

Before
Dozens of data sources with different formats
São Paulo, Seattle, and Singapore scored differently
12-18 month integration projects
Threat data trapped in spreadsheets
Data engineering as ongoing burden
Data at city- or country-level you can't customize
Assessments change depending on analyst
After
One API with standardized output
Same methodology for every location
7-day deployments
BaseScore in GSOC, travel platforms, and risk models
We maintain 25,000+ sources so you don't
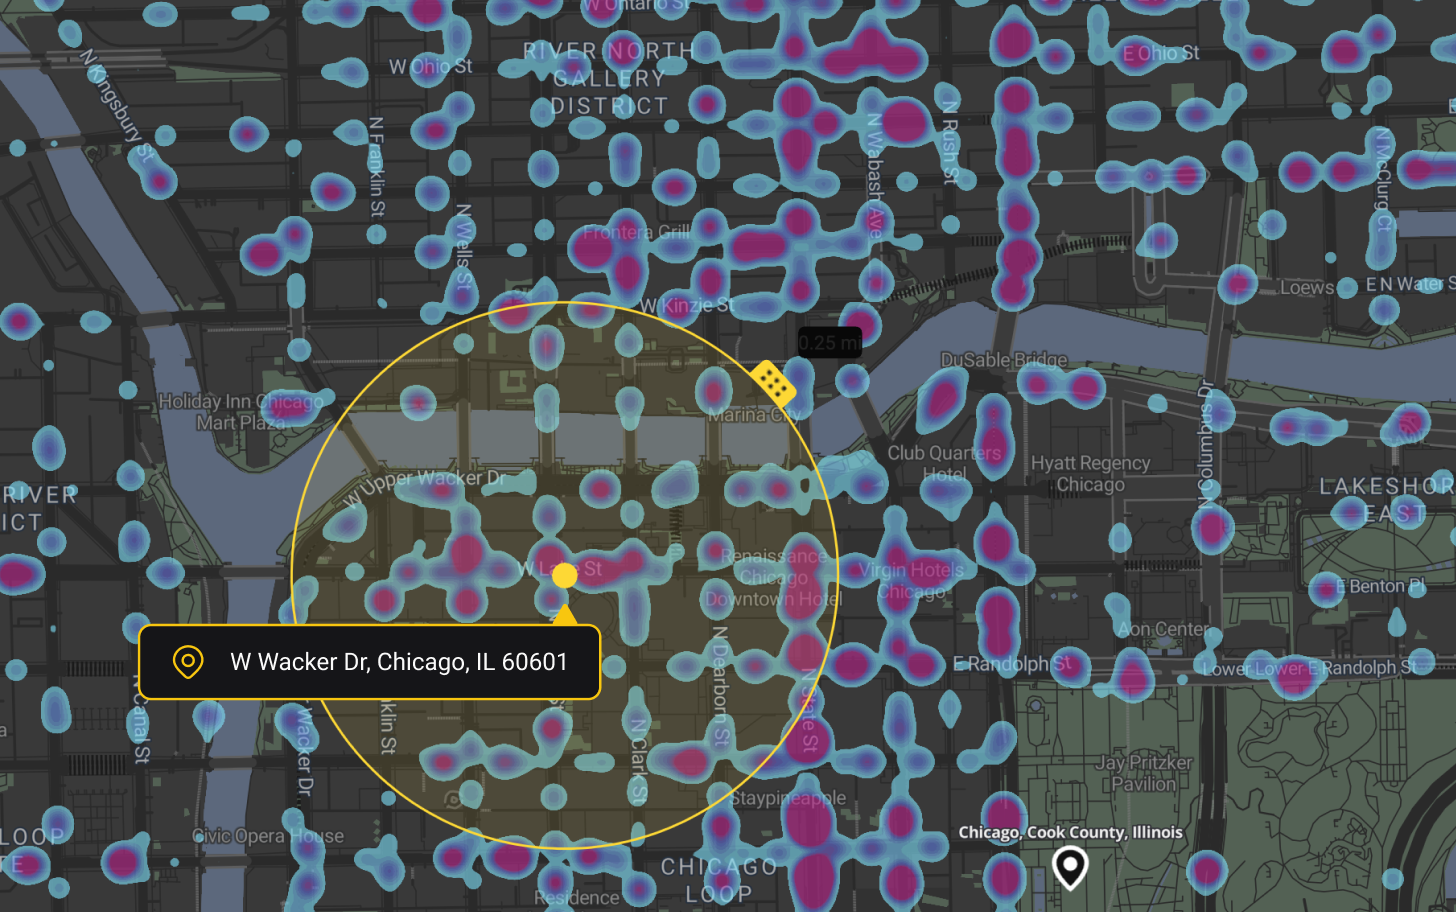
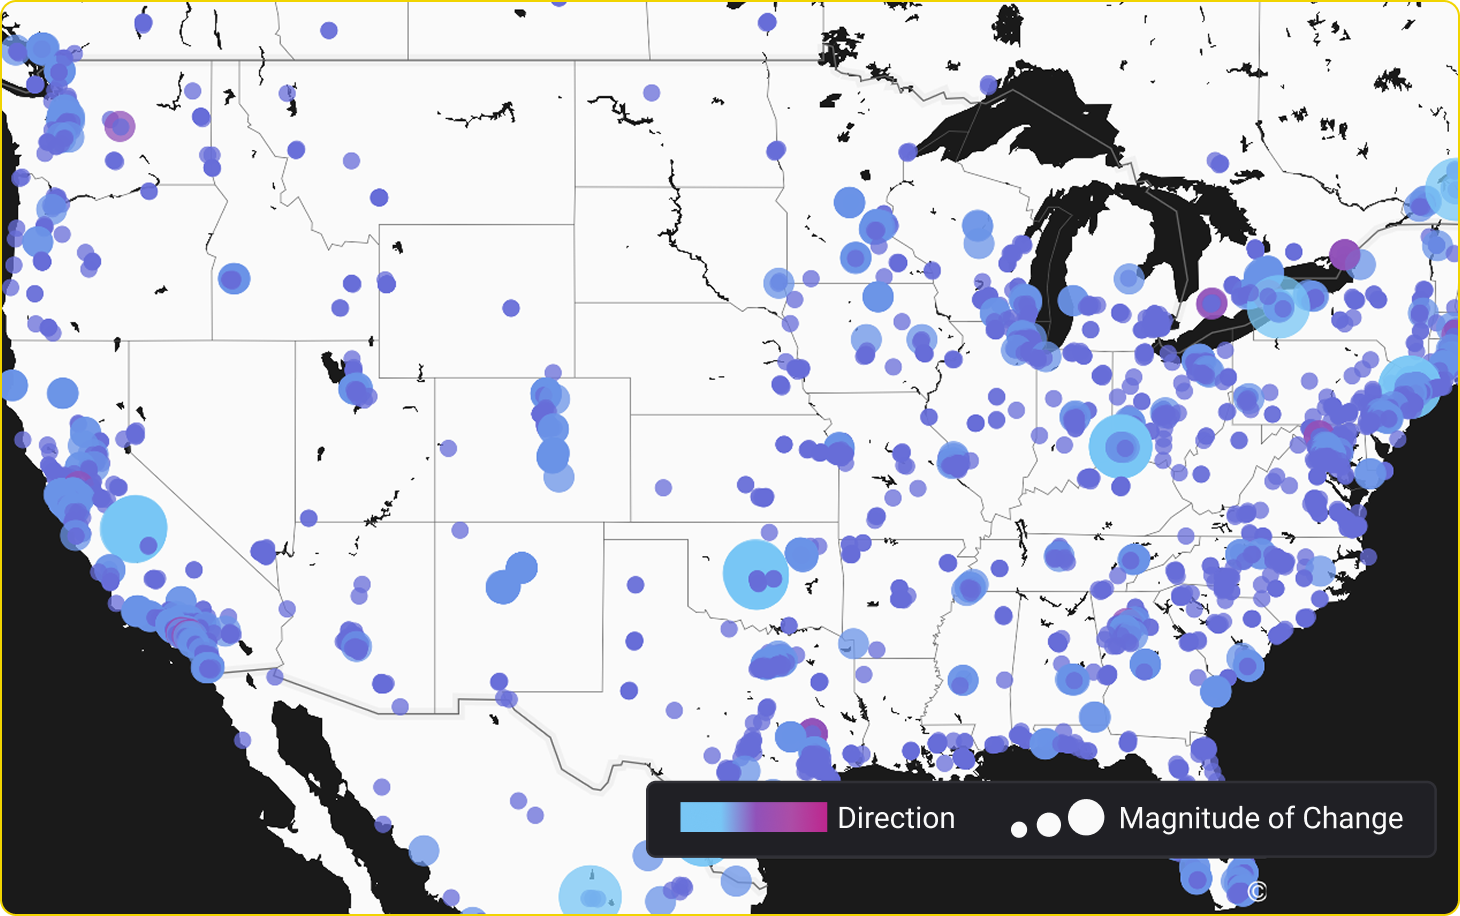
Pull most relevant threats down to 0.1m granularity
Consistent ratings your whole team trusts
How teams use our API today
GSOC monitoring
Feed local threat intelligence for all your locations into your security operations center dashboards to monitor crime and unrest changes.
Risk modeling
Integrate standardized threat data into proprietary risk scoring systems to add location risk as a weighted factor in your models.
Travel security
Connect to your travel management platforms to surface destination-specific risk data for pre-trip approvals and executive protection.
Portfolio monitoring
Track BaseScore and threat trends across your entire location footprint. Automated monitoring identifies shifts that require attention.

Pull standardized local threat data at sub-mile granularity based on 25,000+ global sources.
Eliminate your data pipeline burden.
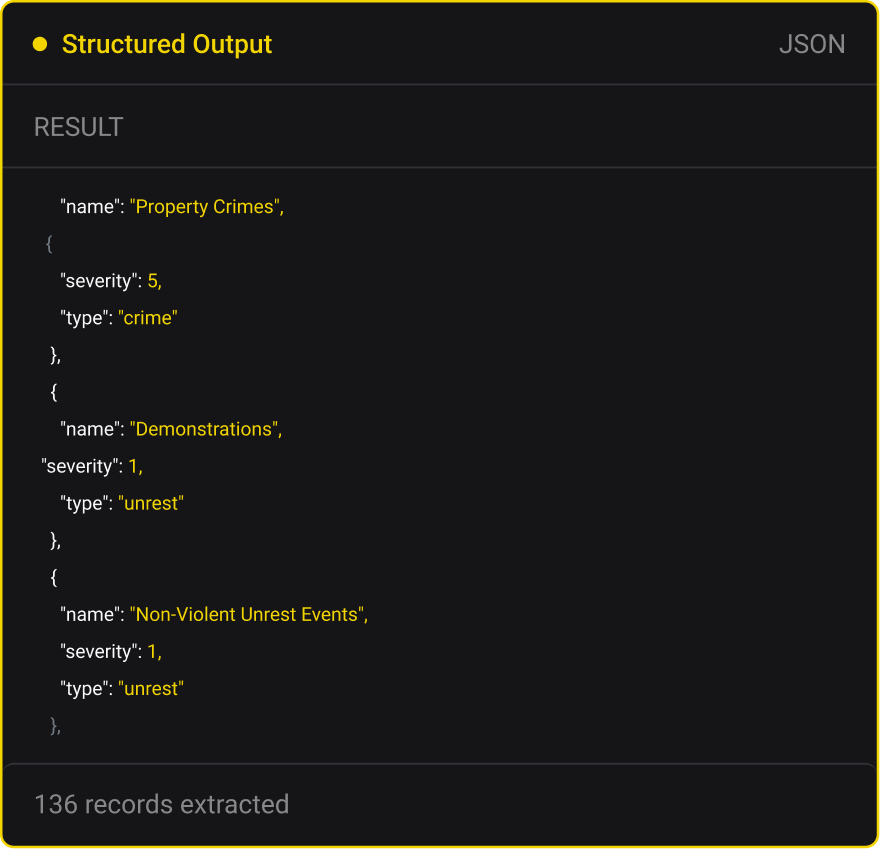
Stop sourcing crime data from police departments, government feeds, and news outlets, then normalizing formats that report differently across every region. Let the API do the work. Get 25,000+ sources and 250 million incidents normalized into one BaseScore (0-100) and 16 standardized threat categories. Query São Paulo or San Francisco and get the same format, same methodology, and same reliability every time.


Extend threat intelligence to every system that needs it
Your GSOC needs to monitor local threat context across your footprint. Your travel platform needs destination risk for pre-trip planning. Your real estate team needs site risk assessment data. Each system requires the same underlying intelligence, but none of them have it. Use one API connection to feed standardized BaseScore and threat data to every tool in your stack.
Deploy in 5 days.
Most threat data integration projects stretch 12-18 months. The API is production-ready today with REST architecture, JSON/CSV responses, full Swagger documentation, and dedicated onboarding support. Most customers go live within 5 days of contract signing.
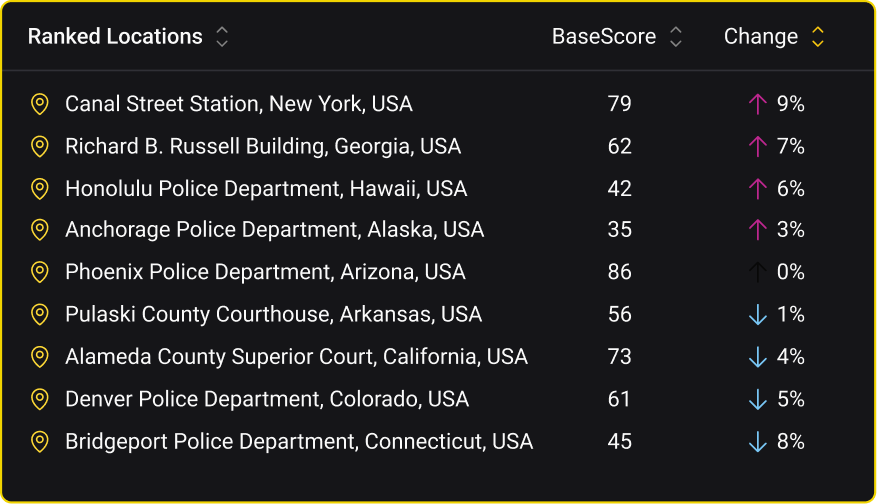

BaseScore
Risk scores (0-100) for coordinates, radius, saved locations, or city/district level.
Threat summary
Incident counts by category within specified area and time range.
Time series
Monthly crime trends and 30-day rolling averages.
Threat categories
Full list of 16 threat types with IDs for filtering.
Saved locations
Manage and query your saved locations portfolio.
Change detection
Trend analysis for significant shifts in threat level.
API Details
API Type
REST API with JSON and CSV response formats
Authentication
API key (X-API-KEY header)
Documentation
OpenAPI/Swagger specification available
Coverage
5,000+ global cities, 99% US coverage
Granularity
H3 grid cells (0.7 mile), configurable radius (from 0.1-5 miles), district, and city levels
Update Frequency
Monthly (crime), Bi-weekly (unrest)
Threat Types
16 categories: 13 crime types + 3 unrest types
Filtering Options
Date Range
ISO 8601 format, custom from/to dates
Threat Type
Crime, unrest, or both
Category ID
Filter to specific threat subcategories
Time of Day
Morning, midmorning, afternoon, evening, night
Months
Filter to specific months of year
Units
Miles, kilometers, or meters

FAQs
Common questions about our threat intelligence API.