
How to Automate Security Risk Assessment Data Collection
Enterprise security teams save 15-20 hours/week per analyst by automating threat data collection. Learn the framework, ROI benchmarks, and implementation roadmap.
The Manual Data Collection Trap
If you're a security analyst spending more time searching for threat data than analyzing it, you're not alone. Corporate security teams waste an average of 20+ hours per analyst per week hunting down crime statistics, political unrest updates, and local threat intelligence across dozens of inconsistent sources.
"We're starting to also hit a point where it's taking up a lot of bandwidth when we need to be spending it elsewhere," explains a Global Security Manager at a Fortune 500 company managing 441 global locations.
The real cost? 70% of analyst bandwidth consumed by manual data collection instead of strategic analysis that actually protects your people and assets.
Here's how leading security teams are eliminating 15-20 hours per analyst per week through systematic intelligence automation. All while improving data quality, expanding coverage, and earning their seat at the executive table.
Why Security Teams Are Stuck Manually Collecting Threat Data
The surface-level problem is obvious: manual data collection is time-consuming, sources are inconsistent, and processes don't scale. But the underlying reality runs deeper.
Workflow Brittleness
Most security intelligence workflows are built on spreadsheets, email-driven data sharing, and manual aggregation that breaks every time stakeholders change or new locations get added to the portfolio. One security director managing a global 3PL operation described their previous approach: "We spent significant time sourcing and correlating data from disparate crime databases, truck depot security reports, and regional threat feeds."
When your intelligence workflow depends on manually hunting down data from 25+ different sources for each assessment, you're not building a scalable system. You're creating a bandwidth drain that gets worse with every new location you add.
No Standardization Across Jurisdictions
Crime data from São Paulo doesn't look like crime data from Singapore. Unrest reporting in Cairo follows different methodologies than threat intelligence in Chicago. When you're manually collecting data across jurisdictions, you end up with inconsistent threat categories, varying update frequencies, and incomparable risk metrics that undermine decision confidence.
Security teams making resource allocation decisions across a global footprint can't justify guard force deployment when one city reports "assault" and another reports "violent crime" using different taxonomies and threat thresholds.
Stakeholder Demands Exceed Manual Capacity
Leadership expects instant, data-driven security decisions for M&A due diligence, event planning, executive travel, and site assessments. But when each location requires 6-8 hours of manual research, your team can only deliver reactive assessments for a handful of locations per week.
The bandwidth math doesn't work: If you manage security for 100+ locations and each quarterly review requires 4-6 hours of manual intelligence gathering, that's 400-600 hours per quarter just for routine monitoring. That's before any urgent requests land on your desk.
The True Cost of Manual Intelligence Gathering
Let's quantify what manual data collection actually costs your security operation.
Time Drain Calculation:
- 20+ hours/week/analyst spent hunting, validating, and normalizing threat data
- Only 30% of analyst time available for strategic work (proactive assessments, trend analysis, executive briefings)
- 2-3 days per location for comprehensive threat assessments at enterprise scale
For a typical security team with 3 analysts, that's 60 hours per week—an entire full-time position—consumed by data gathering instead of risk mitigation.
Strategic Work Lost:
When analysts spend 70% of their time on data collection, what strategic capabilities disappear?
- Proactive threat pattern recognition that prevents incidents before they occur
- Executive briefings that demonstrate security's strategic value and justify budget
- Cross-location trend analysis that optimizes guard force deployment
- M&A security due diligence that protects expansion decisions
Budget Impact:
At an average security analyst salary of $75,000/year (U.S. Bureau of Labor Statistics), manual data collection costs you approximately $52,500 per analyst annually in lost productivity—money spent on data hunting instead of risk reduction.
For a 3-person security team, that's $157,500 per year in wasted analyst capacity.
The automation ROI case writes itself: even a modest reduction in manual work pays for intelligence automation within months.
What to Automate First: The Intelligence Automation Hierarchy
Not all intelligence tasks should be automated. The key is systematically targeting high-volume, low-complexity tasks first while preserving human judgment for nuanced analysis.
The Intelligence Automation Hierarchy (Priority Order):
1. Data Sourcing & Aggregation [Automate First]
Stop manually visiting dozens of crime databases, news feeds, and government portals to collect baseline threat data. This is the highest-volume, lowest-value analyst activity.
How Base Operations automates this layer: 25,000+ global sources automatically aggregated into 150+ million mapped incidents, updated monthly. No manual data hunting required.
2. Data Normalization & Standardization [Automate Second]
Eliminate the hours spent converting inconsistent crime categories, translating foreign language reports, and reconciling different risk methodologies into comparable metrics.
How Base Operations automates this layer: Standardized threat ontology across all locations enables direct BaseScore™ comparison from sub-mile radius up to country level. "Violent assault" in Detroit means the same thing as "violent assault" in Dubai.
3. Routine Reporting [Automate Third]
Quarterly location reviews, stakeholder briefings, and change detection monitoring consume analyst time but rarely require custom analysis.
How Base Operations automates this layer: Unlimited custom reports generated with always-current data. Schedule quarterly briefs once, receive updates forever.
4. Change Detection & Alerts [Augment, Don't Replace]
Identifying significant threat shifts requires automation for speed but human oversight for context and business impact assessment.
How Base Operations augments this layer: Save every location in your footprint into the Locations Dashboard to see the risk distribution across your footprint. BaseScore monthly change detection flags emerging risks automatically. Analysts focus on investigating why the score changed and what it means for operations, not manually checking hundreds of locations for updates.
What to Keep Human:
- Strategic risk judgments involving geopolitical context and operational nuance
- Executive briefings translating threat intelligence into relevant business language
- Custom analysis for unique situations (M&A due diligence, crisis response, emerging threat assessment)
- Recommendations requiring cross-functional context (operations, legal, HR alignment)
The goal isn't to replace analysts. It's to multiply their impact by eliminating low-value data gathering and redirecting saved bandwidth toward strategic decision support.
How to Maintain Data Quality While Automating
The biggest objection to intelligence automation? Trust.
"Will automated data be as reliable as our manual research? How do we know the sources are credible? What if automation misses critical threats?"
These concerns are valid, but they reflect a misconception that manual processes are inherently more accurate. In reality, manual intelligence gathering creates quality problems that automation solves.
The Manual Data Quality Problem:
Source Inconsistency: When each analyst manually selects sources for their assessments, you get different data quality across locations. Analyst A uses official crime statistics; Analyst B relies on news aggregators; Analyst C pulls from regional security forums. The result? Incomparable risk assessments that undermine portfolio-wide decision making.
Recency Gaps: Manual research captures a snapshot at the moment of collection. By the time your quarterly review is complete, the data is already weeks old—and you won't catch changes until the next manual review cycle.
Coverage Blind Spots: Manual processes inherently limit coverage. You can't realistically research 25,000+ global sources for each assessment, so you make educated guesses about which handful of sources matter most. Those guesses create blind spots where threats go undetected.
The Automation Data Quality Advantage:
Multi-Source Triangulation
Base Operations aggregates 25,000+ global sources—government databases, news feeds, incident reports, and local intelligence—into a single standardized dataset. When multiple independent sources confirm the same threat pattern, confidence increases exponentially.
This triangulation approach catches threats that single-source manual research misses while filtering noise that manual analysts waste time investigating.
Consistent Ontology
Every incident is classified using the same threat taxonomy, whether it occurred in Tokyo or Topeka. This standardization enables true apples-to-apples comparison across your entire global footprint.
"One of the things we really trust is the sourcing," explains a Global Security Director using automated intelligence. "When you have that many data feeds normalized into comparable metrics, you can actually make defensible decisions about resource allocation."
Monthly Updates for Recency
BaseScore is recalculated monthly using the most current data, giving you always-fresh intelligence without constant manual refresh cycles. Change detection automatically flags emerging risks, so you don't miss threat shifts between quarterly reviews.
Validation Methodology:
Base Operations employs a proprietary AI system called BaseEngine that:
- Fills sparse-data coverage gaps using pattern recognition across similar locations
- Reduces noise by filtering low-confidence reports
- Validates incidents through multi-source confirmation
- Standardizes incident classification for global comparison
The result: higher-quality intelligence than manual research because automation can maintain consistency, comprehensiveness, and currency at a scale impossible for human analysts.
Integrating Automation with Existing Security Workflows
Here's the good news: you don't have to rip out your entire security infrastructure to gain automation benefits.
The best automation implementations augment current processes instead of forcing wholesale replacement.
The API Integration Approach
Base Operations integrates with your existing security platforms through a REST API that requires minimal IT resources and deploys in under 30 days.
Common Integration Patterns:
Pattern 1: Automated Baseline + Analyst Overlay
Use automation to generate baseline threat assessments across all locations automatically. Analysts add custom context, operational insights, and executive recommendations on top of the automated foundation.
Time saved: 12-15 hours/week per analyst on data gathering. Time invested: strategic analysis and business context.
Pattern 2: Portfolio Monitoring + Escalation
Automate routine monitoring across your entire global footprint. Change detection flags significant threat shifts for analyst investigation.
Example workflow: BaseScore monthly updates automatically. Analyst receives alert when any location increases >10 points. Analyst investigates cause and determines operational impact.
Pattern 3: BaseFusion for Internal Data Integration
Combine Base Operations threat intelligence with your internal data (incident reports, guard logs, employee safety data) using BaseFusion API.
Result: Risk assessments that account for both external threat environment AND your organization's specific vulnerability and incident history at each location.
Real-World Integration Example:
A Fortune 500 technology company with 100+ global offices integrated Base Operations into their event security workflow:
Before automation: 2-3 days per location for manual threat research = 10-15 days for a 5-location event
After automation: 6-8 hours per location using automated baseline + analyst strategic overlay = 30-40 hours for 5-location event
Result: 70% time reduction while maintaining analysis quality. Security team now covers 3x more locations with the same headcount.
The key to successful integration: Start small, prove value, expand systematically.
Pick your highest-volume use case (site assessments, executive travel, quarterly reviews), implement automation, measure time savings, then expand to additional workflows once the team sees results.
Measuring Bandwidth Recovery: Analyst Hours Saved Per Week
You can't optimize what you don't measure. Here's how to calculate—and track—the analyst bandwidth you recover through automation.
Bandwidth Recovery Calculation Worksheet:
Step 1: Audit Current Manual Time Investment
For one typical work week, have each analyst track:
- Hours spent sourcing threat data manually
- Hours spent normalizing/standardizing data from different sources
- Hours spent creating routine reports
- Hours spent on change detection (manually checking locations for threat shifts)
Industry benchmark: Most security teams discover 15-25 hours/week/analyst spent on these manual activities.
Step 2: Identify Automation Candidates
Which activities could be automated?
- Data aggregation across global sources
- Threat categorization and standardization
- Routine quarterly/monthly reporting
- Change detection monitoring
Step 3: Calculate Hours Recovered
Formula: (Hours/week on manual activities) × (% automated) = Hours recovered
Example calculation:
- Analyst spends 20 hours/week on manual data collection
- Automation handles 75% of data sourcing and normalization
- Hours recovered = 20 × 0.75 = 15 hours/week
Step 4: Track Bandwidth Redeployment
The goal isn't just to save time. It's to redirect that time to higher-value work.
Where should recovered analyst bandwidth go?
- Proactive threat assessments: Identify risks before they become incidents
- Executive briefings: Translate intelligence into business impact language that earns security a seat at the table
- Trend analysis: Spot patterns across locations that inform resource optimization
- Strategic planning: M&A security due diligence, business continuity planning, emerging threat research
Proven Benchmarks:
Case Study: Fortune 500 Security Team (75,000+ employees, 100+ locations)
- Before automation: 2-3 days per location for threat assessments
- After automation: 6-8 hours per location
- Time reduction: 70% analyst time saved
- Bandwidth redeployment: Security team now covers 3x more locations with same headcount
- Business outcome: 72 hours faster delivery of event risk assessments; 15 days of analyst time per event reallocated to strategic threat monitoring

Case Study: Global 3PL (1,500+ facilities, 400+ routes)
- Before automation: 50:1 route-to-analyst ratio (limited coverage)
- After automation: 200:1 route-to-analyst ratio with Base Operations
- Capacity increase: 4x analyst capacity without additional headcount
- Business outcome: Advanced route security capabilities became competitive differentiator in customer RFPs
The pattern is consistent: enterprise security teams recover 15-20 hours per analyst per week through systematic intelligence automation, then redirect that bandwidth toward strategic risk mitigation that actually prevents incidents and protects business operations.

Real-World Example: How Enterprise Security Teams Automate at Scale
Let's examine how a Fortune 500 technology company transformed their security intelligence operations from reactive manual research to proactive automated monitoring—at global scale.
The Challenge: Manual Intelligence at 441 Global Locations
"We also only have a team of two to cover, you know, the whole world," explains a Global Security Manager responsible for 441 cities across six continents. "We're doing what we can with the bandwidth that we currently have."
The team's manual process created impossible trade-offs:
- Reactive coverage: Only research locations when stakeholder requests arrive
- Inconsistent analysis: Different data sources for different regions due to bandwidth constraints
- No trend monitoring: Can't proactively track threat changes across hundreds of locations
The Breaking Point: Stakeholder Demands Exceed Manual Capacity
"We're starting to also hit a point where it's taking up a lot of bandwidth when we need to be spending it elsewhere," the Security Manager continued. Leadership expected instant risk assessments for executive travel, event planning, and M&A due diligence—but manual research for each request consumed days of analyst time.
The team faced a classic bandwidth crisis: increasing stakeholder demands, no additional headcount, and manual processes that couldn't scale.
The Solution: Automated Intelligence Across 441 Cities
The security team implemented Base Operations to eliminate manual data hunting across their entire global footprint. Within days of deployment, they established automated monitoring for all 441 locations using BaseScore risk analysis.
Key Implementation Steps:
- Uploaded all global locations into Base Operations My Locations dashboard
- Configured automated reporting for quarterly stakeholder briefings
- Set up change detection to flag emerging risks automatically
- Integrated BaseScore into existing risk assessment templates
No rip-and-replace required. Base Operations augmented their current workflow rather than forcing process overhaul.

The Results: 4x Scale Increase Without Headcount Growth
Operational Capacity:
- 441 cities covered with automated monthly updates (previously: reactive coverage only when requested)
- 50:1 to 200:1 location-to-analyst ratio improvement
- 4x capacity increase for the same 2-person security team
Time Savings:
- 15-20 hours/week/analyst recovered from manual data collection
- Same-day response to stakeholder requests (previously: 2-3 days minimum)
- Proactive threat monitoring instead of purely reactive assessments
Strategic Impact:
"The automation helped us scale our security coverage without expanding the team," explains the Security Manager. "We can now spend bandwidth on strategic analysis—identifying threat patterns, briefing executives, and actually preventing incidents instead of just hunting down data."
The Transformation: From Data Hunters to Risk Advisors
This case study reveals the fundamental shift automation enables:
Before:
- 70% of analyst time: manual data collection
- 30% of analyst time: actual analysis and recommendations
- Coverage: reactive, limited, inconsistent
After:
- 20% of analyst time: oversight of automated data collection
- 80% of analyst time: strategic analysis, executive briefings, proactive threat identification
- Coverage: proactive, comprehensive, standardized across 441 global locations
The team didn't just save time. They transformed their role from reactive data hunters to proactive risk advisors who earn credibility at the executive level.
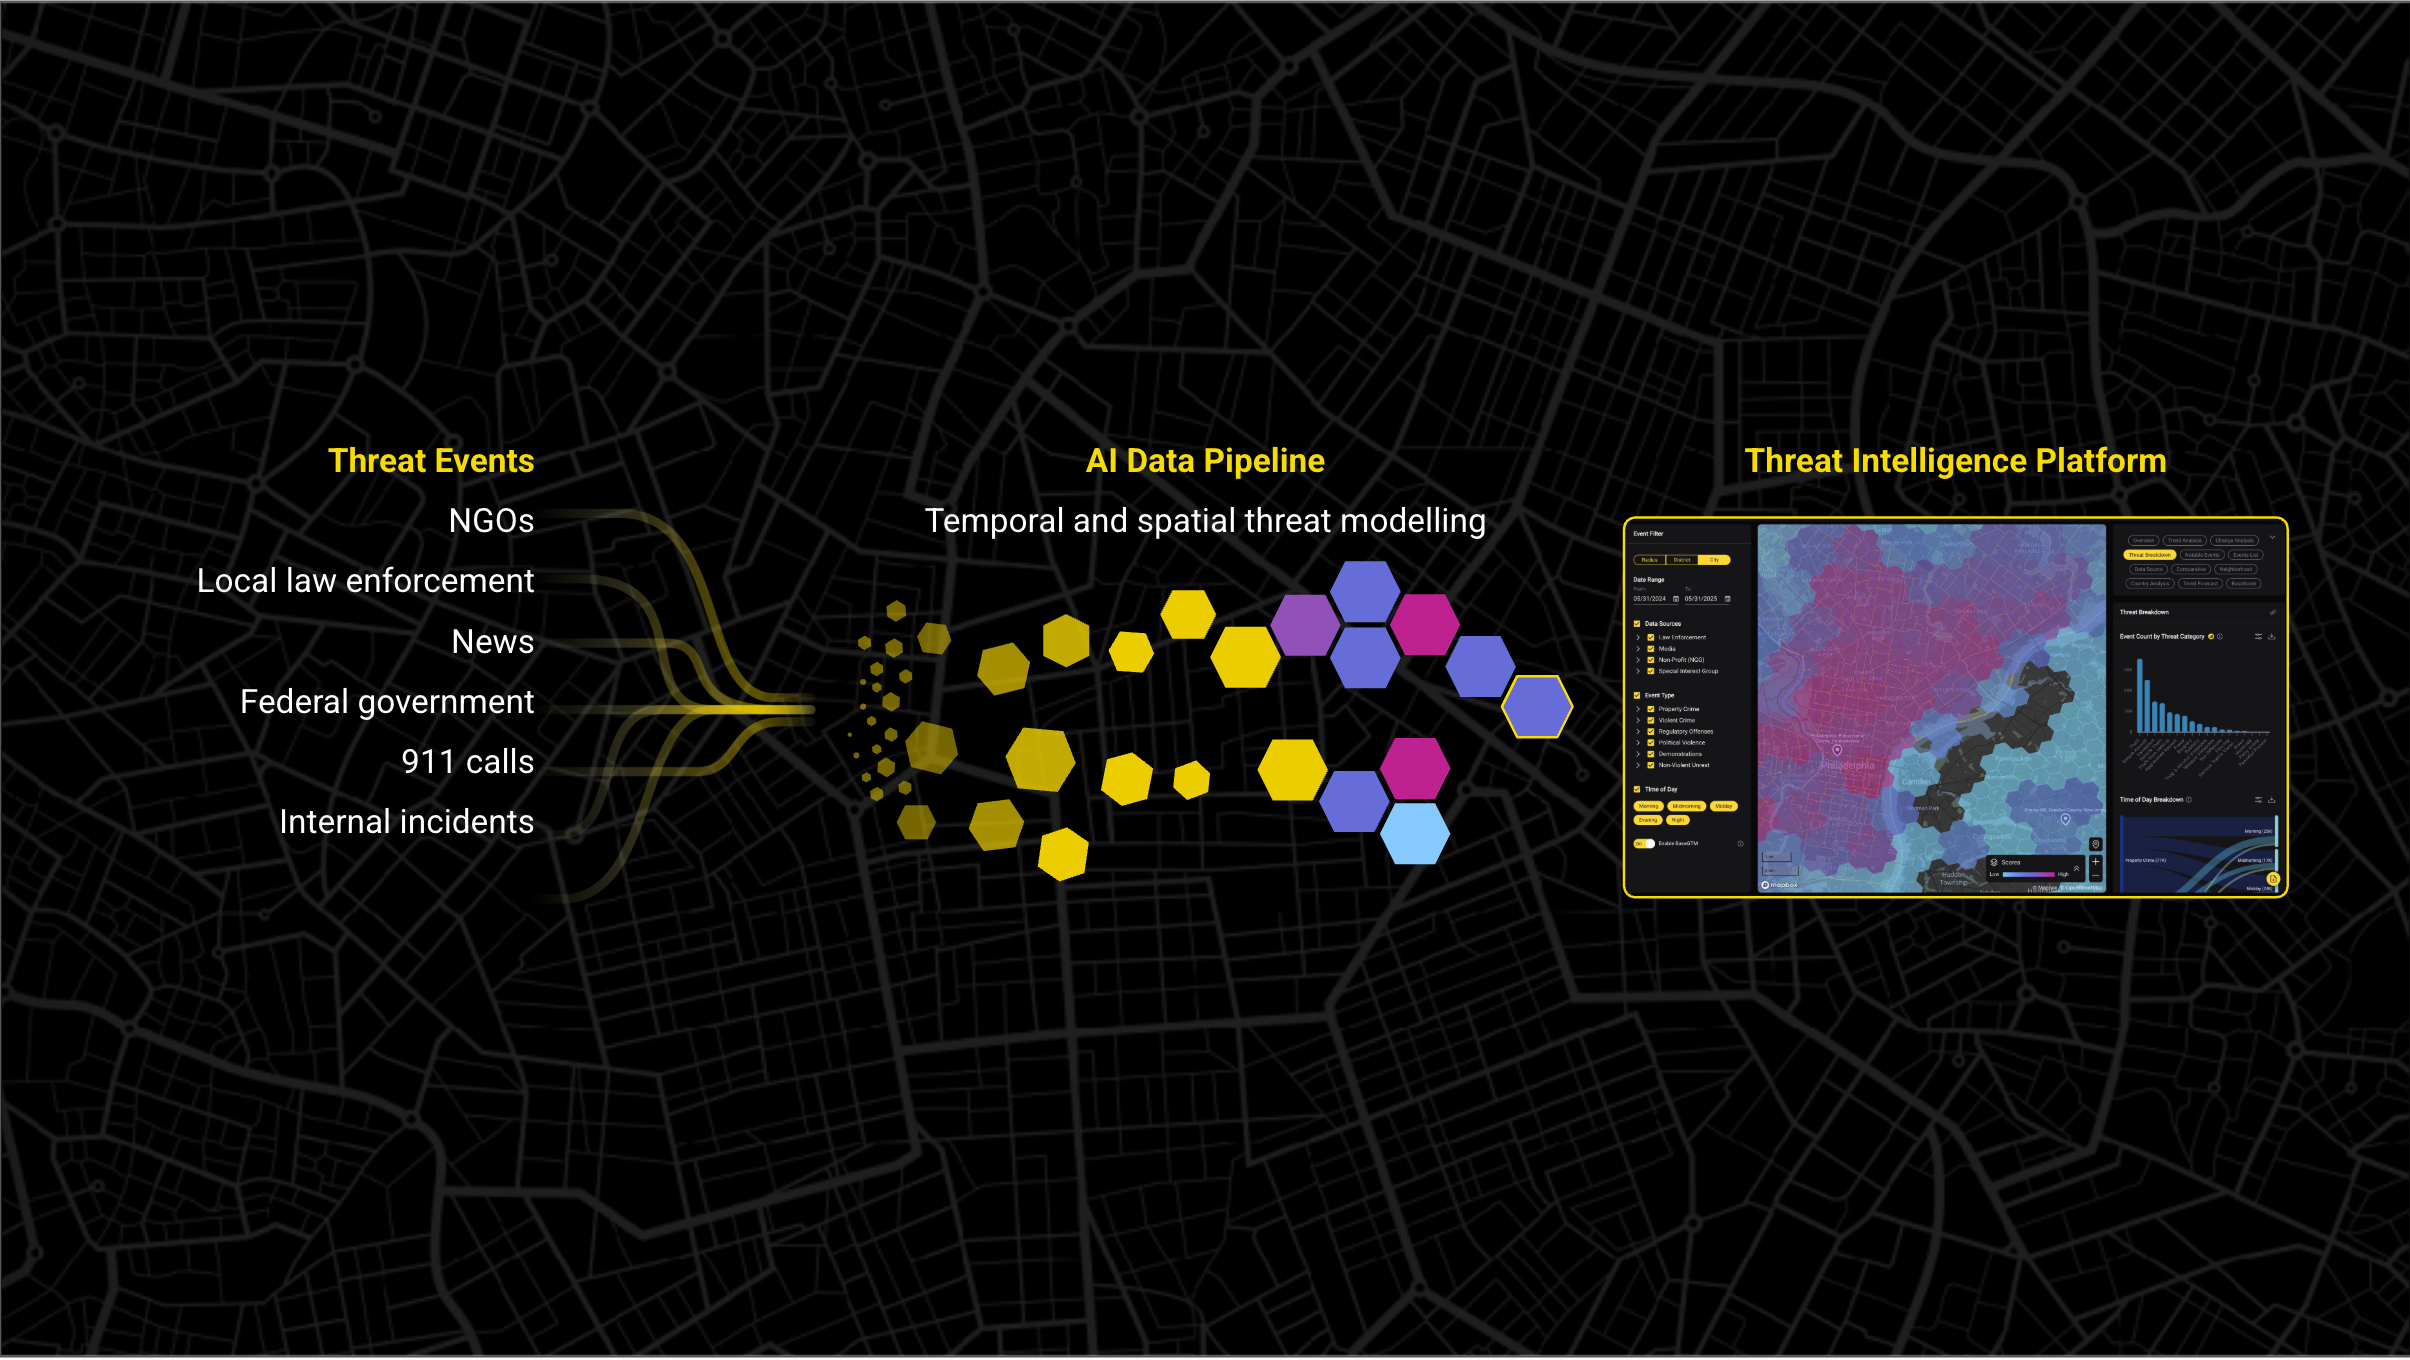
How Base Operations Automates Threat Intelligence Collection
Here's exactly how Base Operations eliminates manual data gathering while maintaining—and improving—intelligence quality.
25,000+ Global Sources, Zero Manual Hunting
Base Operations automatically aggregates threat data from 25,000+ sources including:
- Government crime databases (FBI UCR, local police departments, international agencies)
- News feeds (regional and international media, local incident reporting)
- Security incident databases
- Geopolitical intelligence feeds
What this means for your team: Stop manually visiting dozens of websites, downloading spreadsheets, and piecing together partial data. Access 150+ million mapped incidents through a single platform.
BaseEngine: AI-Powered Coverage and Noise Reduction
Raw data isn't intelligence. Base Operations employs proprietary AI (BaseEngine) to:
Fill Coverage Gaps: When official crime data is sparse (common in developing regions), BaseEngine uses pattern recognition across similar locations to model likely threat levels. You get comprehensive global coverage instead of blind spots.
Reduce Noise: Not every reported incident deserves equal weight. BaseEngine filters low-confidence reports and prioritizes confirmed, high-impact threats so analysts focus on real risks, not false alarms.
Standardize Classification: Automatically categorizes incidents using consistent threat ontology. "Armed robbery" in Rio de Janeiro gets the same classification as "armed robbery" in Rotterdam—enabling true global comparison.
On-Demand Sub-Mile Analytics
Need threat statistics for a 0.5-mile radius around a specific venue? Done in 30 seconds.
Base Operations uses an H3 cell grid system (approximately 1-mile radius cells) to deliver granular analytics at whatever radius you need:
- 0.1-5 mile radius analysis around specific addresses
- District-level threat patterns
- City-wide crime trends
- Country-level risk comparison

No manual research required. Click the location, define your radius, get comprehensive threat statistics including:
- Incident counts by category (violent crime, property crime, unrest)
- Threat patterns by time of day and day of week
- High-risk areas and safer alternatives
- Month-over-month trend analysis
Automated Reporting with Always-Current Data
Generate unlimited custom reports automatically and schedule them for quarterly, monthly, or on-demand delivery.
Example automated workflows:
Quarterly Board Briefing: BaseScore updates for top 50 highest-risk locations, month-over-month changes, resource allocation recommendations. Auto-generated every quarter, always current.
Executive Travel Briefing: Threat assessment for CEO travel itinerary (hotel locations, meeting venues, transportation routes). Generate on-demand in 15 minutes instead of 6 hours of manual research.
M&A Due Diligence: Comprehensive risk profile for acquisition target locations (facilities, employee concentrations, supply chain nodes). Deliver same-day instead of 2-week manual assessment.
API Integration for Platform Flexibility
Base Operations REST API enables integration with your existing security platforms:
- GIS/mapping systems
- Incident management platforms
- Risk assessment frameworks
- Business intelligence dashboards
Deployment: Under 30 days with minimal IT resources. No massive implementation project required.
Use Case: A global 3PL integrated Base Operations into their route planning system, automatically pulling BaseScore data for 400+ transportation corridors. The integration enabled real-time route optimization based on current threat intelligence. These capabilities became a competitive differentiator in customer RFPs.
Getting Started: Your Automation Implementation Roadmap
You don't automate your entire security intelligence operation overnight. Here's the systematic 90-day roadmap for implementing intelligence automation that delivers measurable results quickly.
Phase 1 (Weeks 1-2): Audit Current Manual Workflows
Goal: Identify high-volume automation candidates and establish baseline metrics.
Activities:
Week 1:
- Have each analyst track time spent on manual activities for one full week
- Identify your three highest-volume use cases (site assessments, executive travel, quarterly reviews, M&A due diligence, etc.)
- Calculate current analyst hours per location/assessment
- Document pain points: Which manual steps are most time-consuming? Where do delays occur? What creates bottlenecks?
Week 2:
- Select your POC (proof-of-concept) use case: Pick the highest-volume, most time-consuming activity
- Define success metrics: How many hours/week should automation save? How many more locations should you be able to cover?
- Get stakeholder buy-in: Brief leadership on automation plan and expected ROI
Deliverable: One-page automation charter documenting current state, target state, success metrics, and POC scope.
Phase 2 (Weeks 3-4): POC on Highest-Volume Use Case
Goal: Prove automation value on a contained use case before full deployment.
Activities:
Week 3:
- Deploy Base Operations (under 30 days, typically 1-2 weeks)
- Upload locations for your POC use case into My Locations dashboard
- Configure reporting for this use case
- Train 1-2 analysts on platform (focus on POC workflow only, not full capabilities)
Week 4:
- Run parallel workflows: Manual process (current state) + Automated process (Base Operations)
- Compare time required: Track analyst hours for manual vs. automated approach
- Validate data quality: Ensure automated intelligence meets or exceeds manual research quality
- Gather analyst feedback: What works well? What needs adjustment?
Deliverable: POC results report showing:
- Time savings (hours per location/assessment)
- Data quality comparison
- Analyst feedback and process refinement recommendations
Target Result: 50-70% time reduction for your highest-volume use case.
Phase 3 (Month 2): Measure Time Savings, Expand to Additional Use Cases
Goal: Validate ROI, refine workflows, and expand automation systematically.
Activities:
Week 5-6:
- Calculate bandwidth recovery across team: How many total analyst hours/week saved?
- Identify where to redeploy saved time: Proactive assessments? Executive briefings? Strategic planning?
- Select next 2-3 use cases for automation based on POC success
Week 7-8:
- Expand automation to additional use cases systematically
- Configure custom reports and dashboards for each workflow
- Train full team on relevant platform capabilities
Deliverable: Automation ROI report for leadership:
- Total analyst hours/week recovered
- Number of locations now covered (vs. before automation)
- Cost savings (analyst time × average salary)
- Bandwidth redeployment plan (where saved time is being invested)
Target Result: 15-20 hours/week/analyst bandwidth recovery across full team.
Phase 4 (Month 3+): Optimize Workflows, Train Team on Strategic Analysis Skills
Goal: Maximize automation value by elevating analyst capabilities from data gathering to strategic advising.
Activities:
Month 3:
- Optimize automated workflows based on first 60 days of usage
- Identify remaining manual bottlenecks and eliminate them
- Establish automated monitoring for entire portfolio (all locations, quarterly updates)
Month 3-6:
- Invest recovered analyst bandwidth in strategic skill development:
- Executive briefing training (translate intelligence into business impact language)
- Trend analysis and pattern recognition (identify risks before they become incidents)
- Stakeholder communication (earn security's seat at the executive table)
Ongoing:
- Quarterly automation review: What's working? Where can we improve?
- Expand use cases: As team sees value, they'll identify new automation opportunities
- Track business outcomes: Incidents prevented, faster decision-making, improved executive confidence in security recommendations
Deliverable: Quarterly Business Review for leadership showing:
- Automation ROI (sustained time savings, cost avoidance)
- Coverage expansion (locations monitored, assessments completed)
- Strategic impact (proactive threat identification, executive briefings delivered, security's elevated role in business decisions)
Common Implementation Pitfalls to Avoid:
Mistake #1: "Boil the Ocean" Deployment
Don't try to automate everything at once. Start with one high-volume use case, prove value, expand systematically. Teams that try to deploy comprehensive automation on day one overwhelm analysts and fail to demonstrate clear ROI.
Mistake #2: Automation Without Workflow Redesign
Don't just replicate your manual process faster. Use automation to eliminate unnecessary steps and elevate analyst work to strategic analysis. If you automate a broken workflow, you just get a faster version of a broken workflow.
Mistake #3: No Bandwidth Redeployment Plan
Saving time isn't the goal—strategic impact is. If you save 15 hours/week but analysts just fill that time with busywork, you haven't transformed anything. Have a clear plan for where recovered bandwidth goes.
Mistake #4: Underestimating Change Management
Analysts who've spent years manually hunting data may resist automation. Address the fear: "Will this replace me?" No—it elevates you from data gatherer to strategic advisor. Show the career path, not just the time savings.
Success Pattern:
The teams that achieve fastest ROI and highest adoption follow this pattern:
- Start small (single use case POC)
- Prove value fast (50-70% time reduction in first 30 days)
- Celebrate wins publicly (show leadership and team the measurable impact)
- Expand systematically (add use cases based on proven success)
- Invest in strategic skills (elevate analysts from data hunters to risk advisors)
Follow this roadmap, and you'll have measurable automation ROI within 90 days—and a transformed security intelligence operation within 6 months.
Conclusion: From Reactive Data Hunters to Proactive Risk Advisors
The manual data collection trap keeps security teams stuck in reactive mode—spending 70% of analyst bandwidth hunting threat data instead of analyzing it, protecting it, or preventing incidents with it.
But automation changes everything.
When you eliminate 15-20 hours per analyst per week of manual data gathering, you don't just save time. You transform your security team's strategic role.
The shift automation enables:
From reactive to proactive: Instead of responding to urgent stakeholder requests with 2-3 day manual research, deliver same-day risk assessments and spend recovered bandwidth identifying emerging threats before they become incidents.
From data hunters to risk advisors: Stop manually searching for threat data and start translating intelligence into business impact language that earns security a seat at the executive table.
From bandwidth drain to strategic advantage: Security teams using automation cover 3-4x more locations with the same headcount, deliver 70% faster assessments, and redirect saved time toward proactive threat monitoring that actually prevents loss.
"We can now spend bandwidth on strategic analysis—identifying threat patterns, briefing executives, and actually preventing incidents instead of just hunting down data," explains a Global Security Manager who automated intelligence across 441 global locations.
That's the transformation: From exhausted data gatherers to strategic risk advisors who protect people, assets, and operations proactively.
Your Next Step: Calculate Your Team's Bandwidth Savings
Use the bandwidth recovery worksheet in this guide to calculate exactly how many analyst hours per week your team could recover through automation.
Then ask yourself: What could your security team accomplish with an extra 15-20 hours per analyst per week redirected toward strategic work?
- More locations covered without expanding headcount
- Faster M&A security due diligence
- Proactive threat pattern recognition that prevents incidents
- Executive briefings that demonstrate security's strategic value
- Data-driven resource optimization across your global footprint
See how Base Operations automates threat intelligence collection across 5,000+ global cities, eliminating manual data hunting while improving coverage and quality.
FAQs
Q: Won't automation reduce data quality compared to human research?
A: The opposite is true. Manual research creates quality problems that automation solves:
- Inconsistent sources: Different analysts use different data sources, creating incomparable assessments. Automation uses 25,000+ sources consistently.
- Recency gaps: Manual research is static at time of collection. Base Operations updates BaseScore monthly with always-current data.
- Coverage blind spots: Manual processes can't research thousands of sources per location. Automation maintains comprehensive coverage automatically.
Multi-source triangulation and standardized threat ontology deliver higher-quality intelligence than manual approaches because automation can maintain consistency and comprehensiveness at impossible scale for human researchers.
Q: How long does it take to implement intelligence automation?
A: Base Operations deploys in under 30 days with minimal IT resources. Most teams run their first automated POC within 2 weeks and see measurable time savings (50-70% reduction) within the first month.
The 90-day roadmap in this guide takes you from initial audit through full automation deployment with proven ROI.
Q: What happens to security analysts when you automate their work?
A: Automation doesn't replace analysts—it elevates them.
Instead of spending 70% of their time manually hunting data, analysts redirect that bandwidth toward strategic work that actually prevents incidents and protects business operations:
- Proactive threat assessment and pattern recognition
- Executive briefings translating intelligence into business impact language
- M&A security due diligence supporting expansion decisions
- Trend analysis optimizing resource deployment
The teams profiled in this guide didn't reduce headcount through automation—they multiplied analyst impact by 3-4x while expanding coverage and improving decision quality.
Q: Can automation handle unique/custom security assessments?
A: Yes, through the augmented workflow model.
Base Operations automates the baseline data collection and normalization (the time-consuming, low-value work). Analysts add custom context, operational insights, and strategic recommendations on top of the automated foundation.
Example: For M&A due diligence, automation instantly delivers threat intelligence for all target company locations. Analyst overlays industry-specific vulnerabilities, operational risk factors, and integration recommendations. Result: Custom strategic assessment delivered in hours instead of weeks.
Takeaways

Join 1100+ security leaders getting new ideas on how to better protect their people and assets.