
What Is a Crime Risk Score? How It's Calculated & Used
Learn what a crime risk score is, how scores are calculated using FBI data and demographic models, and how to compare platforms like CAP Index, Pinkerton, and Base Operations.

What a Crime Risk Score Is (In Plain Terms)
is a numeric index that estimates the likelihood of criminal activity at a specific location or asset. Most commercial vendors set the scale so that 100 equals the national average: a score of 50 signals roughly half the average risk, and a score of 200 signals roughly double. Security teams, insurers, and site selectors rely on crime risk scores for three core decisions: physical security resource allocation, insurance underwriting, and real estate site selection. Because risk changes block by block, a useful score is tied to a specific address, census area, or radius, not just a city or ZIP code.
Vendors and buyers do not always agree on what a given number means. A senior risk intelligence analyst at a Fortune 100 telecommunications company asks every new vendor the same question up front, because "zero and a hundred could mean different goods or bads." A security lead at a jewelry insurance consortium described the same gap from the buyer's side: clients hear that they are in a high-risk area with no way to translate that into a decision. The clearest platforms solve this with category-level detail instead of one unexplained number.
How Crime Risk Scores Are Calculated
Commercial crime risk scores combine several categories of input data with a statistical model that turns those inputs into one comparable number. The main inputs are incident-level crime records, census demographics, land-use and business density data, and journey to crime modeling, a spatial-decay technique estimating how offense likelihood declines with distance from an offender's home base or other anchor points.
Primary Data Inputs
Most platforms start with FBI Uniform Crime Reports (UCR) and NIBRS incident data: reported offenses by category and, where available, location. Because raw police data is incomplete (see Data Quality below), vendors layer in census demographic variables (age, household composition, income, education) and land-use data (business density, bar concentration, transit access).
Statistical Modeling Approaches
Vendors combine these inputs using regression models weighted by each variable's historical correlation with crime, machine learning models that capture nonlinear interactions, and spatial interpolation for sparsely reported areas. The blend varies by vendor and is rarely published in full.
Why Demographics Are Used Instead of Raw Crime Counts
Raw crime counts alone produce unstable scores, since police reporting is inconsistent (see Data Quality below). Demographic proxies like age structure, household stability, and income distribution are more consistent across geographies and correlate reliably with crime, so most commercial models use them to stabilize the score.
The Role of Social Disorganization Theory
Social Disorganization Theory is the criminological framework, developed by Clifford Shaw and Henry McKay in 1942, holding that crime concentrates in areas with weak social ties, residential instability, and limited collective oversight, rather than being driven by individual residents' characteristics. It underpins most commercial scoring models: instead of asking who lives in an area, the model asks whether the area has the structural conditions (family stability, socioeconomic status, population turnover) associated with lower informal social control. That framework is also why credible vendors exclude race and ethnicity as inputs and use structural variables instead.
A Big Four accounting firm's security team put methodology transparency at the center of its vendor evaluation, noting the firm has "a standard on what we should put in the platform" and wants assurance the underlying data is "at least quality enough to put in." The same team pairs scores with a map to sanity-check outliers, pulling up a street view when a score looks off to see if a courthouse or transit hub explains the anomaly.
How to Read a Crime Risk Score
The same number means different things depending on the scoring convention, and knowing which one a vendor uses is the first step to reading a score correctly.
Index-Based Scores (e.g., CAP Index, Applied Geographic Solutions (AGS) CrimeRisk)
In the national index score convention, also called a crime risk index, 100 equals the national average: 200 means twice the average risk, 50 means half. The scale is open-ended on the high side, running into the hundreds or low thousands in the highest-risk locations.
Percentile-Based Scores (e.g., NeighborhoodScout, Pinkerton Crime Index)
Percentile-based platforms use a bounded 0 to 100 scale where a higher number means safer, the inverse of the index convention. A percentile score of 90 means the location is safer than 90% of comparable areas, not that its risk is 90% of average.
Color-Coded and Letter-Grade Formats
Some consumer tools, including CrimeGrade.org, translate the score into a letter grade (A through F) or a color scale, trading precision for at-a-glance readability but usually collapsing category-level detail.
Why You Should Use Score Ranges, Not Hard Cutoffs
Because scores are probabilistic estimates, not guarantees, treating a single-point cutoff as a hard rule ignores the model's built-in uncertainty. Tiered ranges (low, moderate, elevated, high) perform better in practice than binary pass/fail thresholds.
That scoring-direction confusion is exactly why the table above ties both conventions to a shared risk-level label. Reading at the category level compounds the value: one enterprise customer described how earlier tooling only returned an aggregate number, while newer platforms let an analyst "give me the base score for property crime overall or give me the base score for robbery."
What Is a Good Total Crime Risk Score?
"Good" is relative, not absolute. It depends on the national benchmark, the industry, the organization's risk tolerance, and which crime type is being evaluated. A score acceptable for a warehouse site is not necessarily acceptable for a jewelry store or a childcare facility.
As a general guide using the index convention: scores below 100 sit at or under the national average and rarely need additional mitigation on their own. Scores between 100 and 200 represent moderate, above-average risk that typically warrants a closer look at specific crime categories. Scores between 200 and 500 signal elevated risk that most enterprise programs treat as requiring mitigation, such as added guarding or camera coverage. Scores above 500 typically flag locations where several major retailers and site selectors decline to operate without significant controls.
A Fortune 500 discount retailer's director of market strategy and site analytics described exactly this kind of tiering: some locations are filtered out entirely because violence is too high, others clear that bar but require a guard on-site, affecting the location's profit and loss, and a third tier is safe enough to operate but flagged for expected shrink. Without a threshold framework, a score is just a number. A power infrastructure company's security lead said as much about an earlier vendor's output: the number did not mean anything to the team, and nobody acted on it.
Types of Crime Included in a Score
Most commercial platforms follow the FBI's crime taxonomy, which splits total crime into violent crime and property crime and calculates each independently before rolling them into a composite.
Violent Crime Scores Defined
Violent crime covers offenses involving force or the threat of force against a person: murder, rape, robbery (theft by force or threat), and aggravated assault (an attack intended to cause serious injury, often with a weapon).
Property Crime Scores Defined
Property crime covers offenses against property: burglary (unlawful entry to commit a crime), larceny-theft (taking property without force), motor vehicle theft, and arson.
Total Crime Score vs. Category-Level Scores
A composite total crime score can mask meaningfully different risk profiles: a high-theft, low-violence location and a high-violence, low-theft location can land on the same total score while requiring different security responses. One enterprise customer historically had to request each category separately, since older platforms only returned the aggregate. The discount retailer cited above runs separate frameworks for violence (site closure), property crime (guard placement), and shrink (operational forecasting), illustrating why a single blended number is not enough.
Geographic Resolution: How Specific Can a Crime Risk Score Get?
Geographic resolution is the size of the area a crime risk score represents, ranging from an entire ZIP code down to a single address. Resolution changes what a score can tell you: a ZIP code average can hide a dangerous block sitting next to a safe one.
ZIP Code vs. Census Block Group vs. Address-Level Scoring
ZIP code-level scores average risk across a wide, often irregularly shaped area that was never designed for crime analysis. Census tract scores narrow that to a few thousand residents. The census block group, a Census Bureau geography of roughly 600 to 3,000 people, of which there are about 220,000 nationally, is the standard resolution for most commercial products: small enough to reflect local conditions, large enough to have stable population data. Address- or parcel-level and radius-based scoring go a step further, useful when a decision hinges on one specific site rather than a neighborhood.
Why Neighborhood Boundaries Matter for Score Accuracy
Two adjacent block groups separated by a single street can carry markedly different scores if one contains a transit hub, bar district, or high-traffic retail corridor and the other doesn't. A power infrastructure company's security lead described running into exactly this limit with a legacy vendor: "every Downtown Los Angeles site has the same crimecast score... they're all Downtown LA," with no way to distinguish between two specific addresses a few blocks apart. Feedback from a global pharmaceutical company points to a practical sweet spot: a quarter-mile radius is useful for about 20% of use cases, while a half-square-mile radius works best the rest of the time.
Business Applications: Who Uses Crime Risk Scores and How
Crime risk scores support decisions across physical security, real estate, insurance, loss prevention, executive travel, logistics, and legal documentation. Resolution and refresh cadence needs vary by use case.
Physical Security & Resource Allocation
Security teams use category-level scores to decide where to add guards, cameras, or patrol frequency. One case study documented a 70% reduction in analyst time on site security diligence. A director overseeing tens of thousands of security personnel at a global facilities services provider put it directly: budgets often get allocated by legacy habit rather than current risk, so resourcing doesn't match "the risk score for that area."
Real Estate Site Selection & Portfolio Management
A global security consultancy used crime risk data to double the number of new site evaluations it could complete for a client's real estate division, folding security into site selection earlier instead of treating it as a late-stage check.
Insurance Underwriting
Underwriters use crime risk scores, often alongside CoreLogic and LexisNexis, to price property and casualty coverage. Address- or block-group-level resolution supports more accurate rating than city-wide averages.
Loss Prevention
The discount retailer described earlier runs separate thresholds for guard placement and shrink forecasting, using property crime scores for operations and violent crime scores for go/no-go decisions on individual stores.
Executive Travel & Duty of Care
Security teams use location scores to compare hotel options, map city-wide crime patterns before a trip, and set time-based safety protocols, an increasingly documented requirement for duty-of-care programs.
Delivery, Logistics & Field Operations
Beyond the 4x scale increase cited above, a global 3PL also cut route assessment costs 75%, moving from a roughly 50-to-1 ratio of routes to analysts to a workflow able to keep pace with the network. Loss-prevention researchers have pointed to growing demand for dynamic, risk-aware routing as the next step for supply chain security.
Legal & Litigation Support
Crime risk scores can document that an organization exercised reasonable care in a security or duty-of-care decision, provided the methodology is transparent and the report is archived with a timestamp (more on this in the practice section below).
Crime Risk Score Platforms Compared
Commercial crime risk platforms differ on scoring convention, resolution, refresh cadence, and use case. This is a decision framework, not a ranking.
Comparison Table: Crime Risk Score Platforms at a Glance
Location-Based Scores for Enterprise Security & Site Selection
CAP Index/CRIMECAST and Base Operations both serve corporate security and site selection buyers, but resolution is a meaningful differentiator, as the power infrastructure company's "every Downtown LA site has the same crimecast score" example illustrates. The same company also described buying a bulk allotment of CRIMECAST reports that later expired, forcing ad hoc reordering.
Crime Risk Data for Insurance Underwriting
CoreLogic, Precisely, and AGS CrimeRisk are the more commonly cited players for insurance underwriting, where parcel- or block-group-level scores feed into property and casualty rating models.
Consumer-Facing Neighborhood Crime Scores
NeighborhoodScout and CrimeGrade.org serve a different buyer: individual home buyers and renters checking a single neighborhood, not enterprise teams managing a portfolio. These tools trade category-level detail for simplicity and a low price, a tradeoff that fits a one-time lookup but not a program managing hundreds of sites.
, a free tool, generates an instant threat assessment for any address using the same street-level data behind BaseScore. Run a handful of your own locations before deciding which platform fits your use case.
Individual-Level vs. Location-Based Crime Risk Scores
Crime risk scoring covers two entirely different domains that are easy to confuse. Location-based scores, the subject of this article, estimate risk for a place: an address, a block group, a city. Retailers, insurers, and security teams use them to decide where to operate, how to staff, and how to price coverage.
Individual-level risk scores estimate predictive crime risk for a specific person: the likelihood that they will reoffend or fail to appear in court. Tools in this category include COMPAS (built by Northpointe/equivant), the Public Safety Assessment, or PSA (developed by Arnold Ventures), and the LSI-R (from Multi-Health Systems). Courts, parole boards, and corrections departments use these tools for pretrial release and sentencing decisions, governed by different legal and ethical standards than commercial location scoring.
Base Operations, like CAP Index, Pinkerton, and the other platforms compared above, operates exclusively in the location-based domain. It scores places, not people, and has no involvement in individual risk assessment, sentencing, or corrections decisions.
Data Quality, Bias, and Limitations of Crime Risk Scores
Every crime risk score inherits the limitations of its underlying data. Being direct about those limitations is part of using scores responsibly.
Why Race and Ethnicity Are Not Scoring Variables
Reputable commercial models exclude race, ethnicity, ancestry, and language entirely. In their place, they use structural variables grounded in Social Disorganization Theory: age distribution, household composition, income, education, and residential stability, factors tied to an area's level of informal social control rather than any individual resident's characteristics. Because some proxies can still correlate with racial demographics in a given area, bias remains an active area of scrutiny even where models are built to avoid it directly.
The Problem of Incomplete Police Reporting
The US has roughly 18,000 law enforcement agencies, and not all report consistently to the FBI's UCR/NIBRS system. Reporting completeness, timeliness, and geocoding accuracy vary by department, which is why commercial models layer in demographic and land-use data rather than relying on raw incident counts alone.
How Often Scores Are Updated, and Why It Matters
Refresh cadence ranges from monthly to annually across the market. Base Operations updates crime data monthly (bi-weekly in many areas) and unrest data bi-weekly. A stale score can miss a real shift in conditions, which is why refresh cadence belongs on any vendor evaluation checklist alongside coverage and resolution.
Scores Are Probabilistic, Not Predictive of Specific Events
A crime risk score forecasts relative likelihood across a population of similar locations; it does not predict a specific incident at a specific address on a specific day. Crime data is not evenly distributed, and most locations score below the national average of 100, with risk concentrated in a smaller number of higher-scoring areas.
Independent validation is still an open question across the industry. One loss prevention research organization's director of research put it directly: using a vendor's own data as an outcome measure "doesn't do anything necessarily to validate" that solution, so the group would run its own study instead. An insurance carrier's data science manager raised a related problem: without historical data to benchmark against, a new score is hard to fold into an existing model. Both points argue for treating any score as one input, checked against outcomes over time, not a standalone verdict.
How to Use a Crime Risk Score in Practice
Turning a score into a decision takes a defined process, not just a number.
Step 1: Define Your Use Case and Resolution Requirements
Match the use case to the resolution it needs. Site selection and executive travel usually need address- or radius-level precision; portfolio-wide trend monitoring can work with block-group resolution.
Step 2: Choose the Right Scoring Methodology and Radius
Decide whether an index or percentile convention fits your existing risk reporting, and pick an analysis radius that matches the decision: a tight radius for a single site, a wider radius for a market-level view.
Step 3: Set Risk Tiers, Not Hard Cutoffs
Build tiered thresholds rather than a single cutoff. The discount retailer's model is a working example: one tier where violence is too high to operate at all, a second where a location is viable but needs a guard, a cost that has to work with the location's economics, and a third that's safe enough to open but likely to see elevated shrink.
Step 4: Integrate Into GIS or Security Platforms
Bring the score into the systems your team already uses. The retailer's GIS team runs batch scoring across roughly 4,000 annual site assessments, pulling data in as a feature or map service inside its existing mapping environment and feeding it into automated Python workflows rather than manually looking up each address.
Step 5: Document for Legal Defensibility
Archive the score, the methodology, and the date it was pulled alongside the decision it informed. The security consultancy referenced earlier used this kind of documented, data-driven input to double the number of site evaluations its client's real estate division could complete, giving the team a record of why each site was approved or declined.
Crime Risk Score for Real Estate and Property Investment
Real estate investors, developers, and property managers use crime risk scores throughout the asset lifecycle: during site selection, during lease negotiation, and as an ongoing input to portfolio management. Crime risk connects directly to property value, insurance cost, tenant satisfaction, and time-to-lease, making it one factor in due diligence rather than a standalone pass/fail filter.
The scale of these decisions can be substantial. Teams advising multinational companies on market entry have described betting billion-dollar expansion decisions on intelligence that used to be compiled by hand: searching, reading local news, and assembling a report from scratch for each new market. A Fortune 100 financial services company's internal risk intelligence team shows where reliable data ends up: the team expanded well beyond its original workplace-safety mandate to also serve real estate and HR, because the same underlying location data supported decisions across all three.
The security consultancy case cited throughout this article doubled the number of new site evaluations it completed for a client's real estate division after adding crime risk data earlier in the site selection process, turning security from a late-stage check into an earlier input alongside cost, access, and market fit.
Free vs. Paid Crime Risk Data: What's the Difference?
Free public sources, including the FBI Crime Data Explorer and individual police department open-data portals, provide raw incident counts and city- or agency-level aggregates. They're useful for historical research but come with real limitations: coverage gaps where agencies don't report, inconsistent formatting between jurisdictions, and no modeling layer to turn raw counts into a comparable score.
A global 3PL described exactly this problem before adopting a commercial platform: pulling from multiple systems that "provided varying levels of detail and reliability, making it difficult to establish standardized risk baselines" across regions. Assembling that data by hand also costs analyst time. A Fortune 100 telecommunications company's risk analyst estimated that a single manual assessment, gathering, producing, and formatting a report, takes "usually a day," or a full workday when the request is high priority.
Commercial crime risk scores address these gaps: modeled risk instead of raw counts, address- or block-group-level resolution instead of city aggregates, a normalized benchmark for comparing locations, and a documented refresh cadence. Base Operations refreshes crime data monthly (bi-weekly in many areas), still a meaningful step up from annual or ad hoc free-data refreshes for a team managing an active footprint.
Frequently Asked Questions About Crime Risk Scores
What is a good total crime risk score?
A "good" score is relative to the national average, your industry, and your risk tolerance, not an absolute number. Using the index convention (100 = national average), below 100 sits at or under the benchmark, 100-200 is moderate risk, 200-500 is elevated risk most programs mitigate, and above 500 flags locations needing significant controls.
How is a crime risk score different from a crime rate?
A crime rate is a raw count: reported crimes per population in a defined area and time period. A crime risk score is a modeled forecast that adds demographic, land-use, and spatial variables, normalized onto a comparable scale (typically 100 = national average). A crime rate tells you what happened; a crime risk score estimates what's likely next.
How often are crime risk scores updated?
Update frequency varies by vendor, from monthly to annually. Base Operations updates BaseScore crime data monthly (bi-weekly in many areas) and unrest data bi-weekly: on-demand assessment, not continuous alerting. Customers can use the REST API to trigger their own alerts on a score change; event-driven platforms like Dataminr or Everbridge handle faster alerting, and many teams run both.
Are crime risk scores biased against certain neighborhoods?
Commercial models exclude race, ethnicity, ancestry, and language as scoring variables. In their place, they use structural variables grounded in Social Disorganization Theory: age distribution, household composition, income, education, and residential stability. Because some proxies can still correlate with racial demographics, bias remains an active area of scrutiny, and credible vendors publish methodology so buyers can check it.
What is the national average crime risk score?
In the most widely used convention, 100 represents the national average crime risk. A score of 50 is roughly half the average; 200 is roughly double. CAP Index, AGS, and Base Operations' BaseScore all use this convention, while percentile platforms like NeighborhoodScout invert it (higher equals safer), so confirm the convention first.
Can I get a crime risk score for any address in the U.S.?
Most platforms score any U.S. address by mapping it to the nearest census block group, of which there are roughly 220,000 nationally. Some, including Base Operations, offer finer resolution: a 0.1-mile radius or an H3 hex cell of roughly 0.8 miles. Base Operations covers 99% of the US.
What crime types are included in a total crime risk score?
A total crime risk score aggregates violent crime and property crime, per the FBI's Uniform Crime Reporting taxonomy: violent crime covers murder, rape, robbery, and aggravated assault; property crime covers burglary, larceny-theft, motor vehicle theft, and arson. Most enterprise vendors also provide category-level scores, since a high-theft location can carry a different profile than a high-violence one at the same total.
How do I use a crime risk score for legal or litigation purposes?
Crime risk scores support legal defensibility by documenting data-driven diligence in a security or duty-of-care decision. Source the score from a vendor with transparent methodology, record the score and date pulled, and archive it with the decision it informed.
What is CRIMECAST by CAP Index?
CRIMECAST is CAP Index's proprietary crime risk scoring system, in use for more than 30 years. It uses the index convention (100 = national average) with scores from roughly 1 to 2000+, widely used in retail loss prevention and commercial real estate at the address or block-group level.
How does Base Operations calculate its crime risk scores?
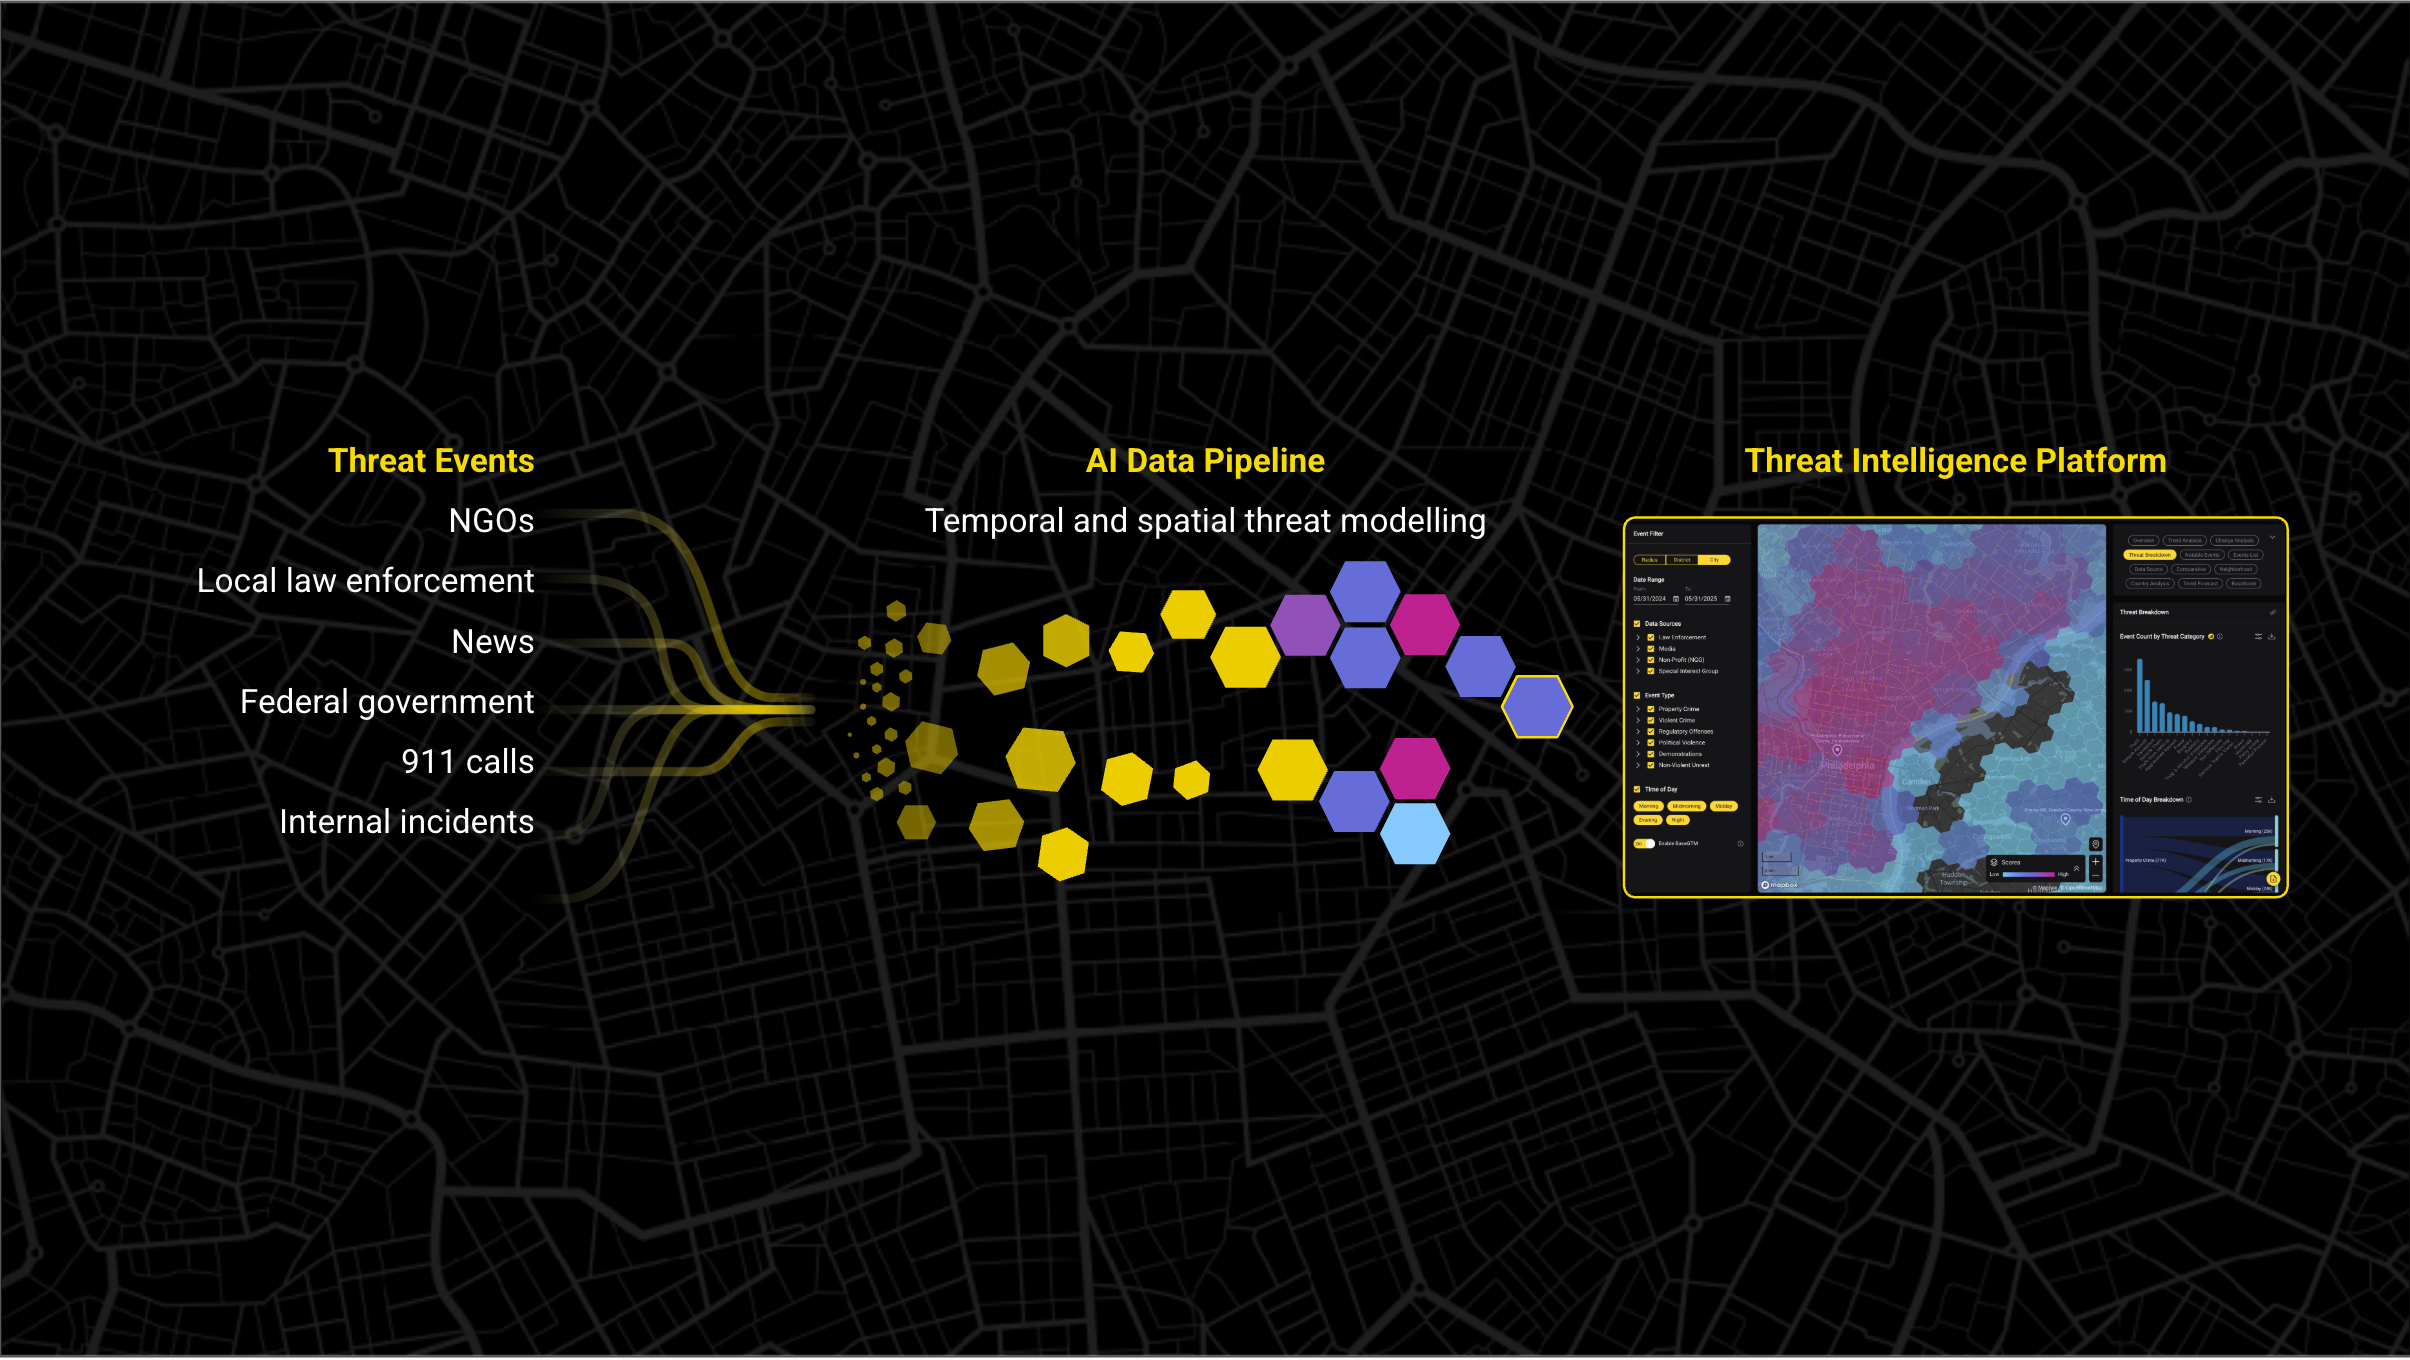
Base Operations aggregates 25,000+ global data sources into BaseScore, a 0-100 index normalized for population and area. The model weights offense severity (violent above property, homicide above fraud) and resolves to a 0.1-mile radius or H3 hex cell (~0.8 miles), updated monthly (bi-weekly in many areas), with category-level breakdowns alongside the composite total.
What is the difference between a crime risk score and a safety score?
A crime risk score quantifies the predicted likelihood of criminal activity, typically on a scale where higher means higher risk. A safety score is usually a consumer-facing metric on the inverse scale, where higher means greater safety. Confirm which direction a vendor's scale runs before comparing numbers across platforms.
Can crime risk scores be integrated into a GIS or existing risk platform?
Yes, most enterprise vendors offer integration beyond a static report, including REST APIs, GIS-compatible formats like shapefiles and feature services, and flat-file or batch delivery. One discount retailer's GIS team runs batch scoring across roughly 4,000 site assessments a year, pulling hex-level crime data in as a feature service inside its mapping environment.
Ready to see category-level crime risk scoring for your own footprint? Base Operations covers 5,000+ global cities at sub-mile resolution, refreshed monthly. Try Base CoPilot free to generate your first threat assessment report, or talk to our team about a demo.

Takeaways

Join 1100+ security leaders getting new ideas on how to better protect their people and assets.


.png)